


Nowadays, there are many web analytics tools besides GA4, and people often use different ones depending on their needs. It seems like we’ve reached a point where it’s become the norm to pay for website analytics tools.
Of course, GA4 can be a bit daunting for beginners, but the fact that you can analyze the data you want to know without spending any money is a major advantage.
So, in this article, I’ll be writing for those who want to start analyzing their websites with GA4 or learn how to use it more effectively. However, for those who are just getting started with GA4, there are likely many parts that seem difficult because you’ll be encountering new terms and concepts, aren’t there?
Especially once you start playing around with “Explore,”
"I used to be able to view reports in UA—how do I view them in GA4…?"
"What are dimensions and metrics...?"
"I think I managed to turn in the report, but is it really correct?"
"I don't know how to use segments..."
I wonder if some of you might find yourselves stumbling over this?
So in this post, I’ll start by covering the essentials so that even those who are just getting started with GA4 can learn how to use the “Explore” feature.
What You Need to Know to Start Using “Explore”
Since some prior knowledge is required to use the “Explore” feature in GA4, if you’re a little unsure about Google Analytics, please be sure to read this chapter.
Differences Between GA4 and UA
First, since some of you reading this article may have used UA, I’ll start by explaining the differences between GA4 and UA.
First, there is a fundamental difference between GA4 and UA in how they collect data.
So far,At UA, the focus is on pagesTo analyze the data, for each browser...Session TrackingI was doing that, but,GA4 is user-centricTo analyze the dataEvent TrackingI will do that.
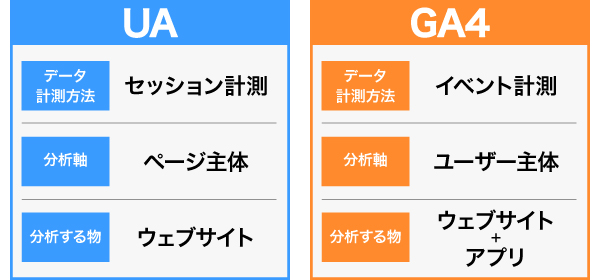
There are several reasons for this change, including the increased use of smartphones and stricter personal information protection regulations, but essentially, the previous UA method was no longer effective at collecting data.
In addition, by tracking all data through event measurement, we are now able to gather more detailed information about which devices each user is using and how they navigate between the app and the website.
About the Event
First, I’d like to briefly explain what event tracking is all about.
First, when a user visits the site (i.e., views a page), that triggers,“The ”page_view" event is triggeredAlthough this is the case, the “page_view” event contains multiple data points—such as the “page URL” and the “previous page URL”—and reports are generated based on this information.
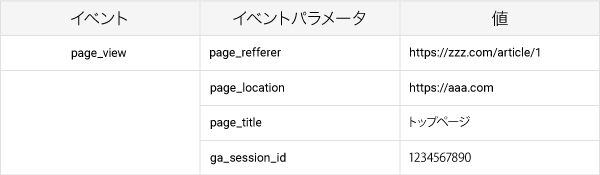
“page_location” represents the “page URL,” and "page_refferer" represents the "previous page URL." The event and the data it contains are referred to as "event," "event parameters," and "values," respectively.
<例:page_view>
“page_view” as an event
“page_location” as an event parameter
“hideandseek.co.jp/contents/~~” as the value
GA4 includes several events that contain this type of data by default (as standard features), and there are various triggers that determine when they fire.
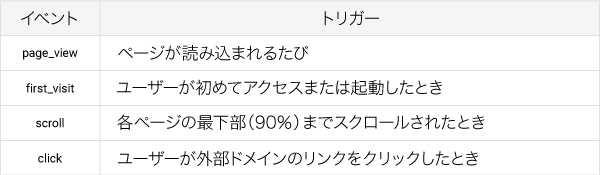
Reference:https://support.google.com/analytics/answer/9234069
And when it comes to exploration,You need to have a general understanding of what event parameters and values are included in an event.
The Difference Between “Explore” and “Report”
A new feature called "Explore" has been added to GA4, but how does it differ from "Reports"?
First, in the “Reports” section, you can quickly view a summary of frequently used events and event parameter information.
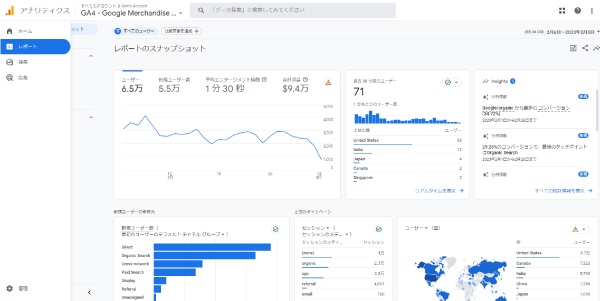
However, on this screen,
「This page (Variable 1)fromPeople who downloaded the materials (Variable 2)はWhat kind of person (Variable 3)"I guess there are a lot of them."
「The one with the highest number of purchases (Variable 1)The reason is that,Which ad code (Variable 2)That's probably why. At the same time,Number of Sessions (Variable 3)"I want to know that, too."
We are unable to obtain that kind of information.
As mentioned above,Searching is particularly useful when you want to find information that requires three or more variables.
In other words, you use “Search” when you want to get more detailed information than what’s in the report.
Six Methods of Exploration
When you go to the "Explore" page in the GA4 admin console, you'll find six methods available.
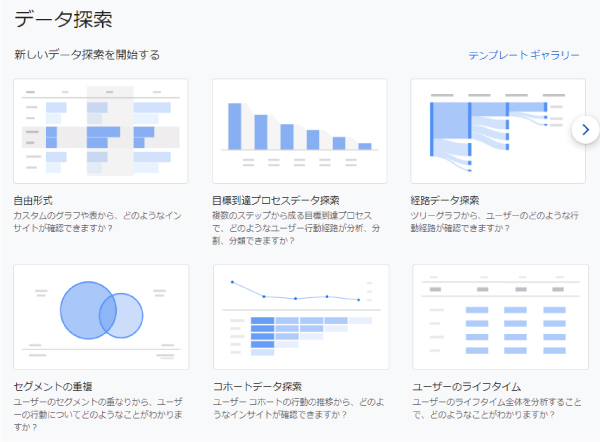
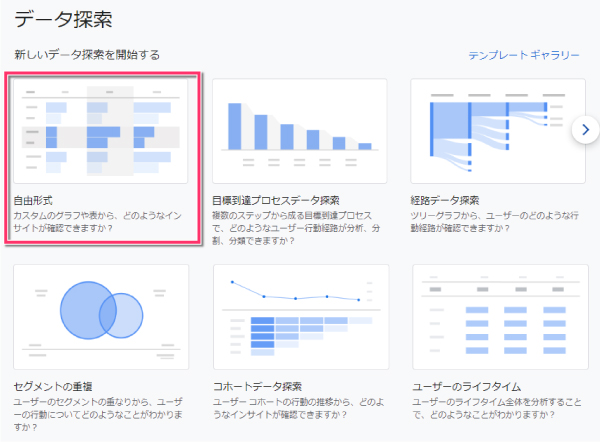
You’ll use each one depending on your purpose, but since it might be hard to understand at first if you’re not familiar with the elements used in exploration, let’s start with “Free Form” to get used to exploration in general.
What Are “Dimensions” and “Metrics”?
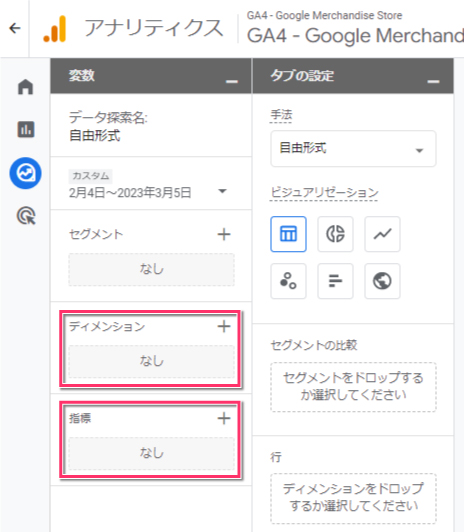
When you click on "Free Form," you'll see "Dimensions" and "Metrics" on the left side.
If you used reports frequently in UA, this might still feel familiar to you, but if you haven’t used them much, it’s probably a bit confusing, isn’t it?

To put it simply, in the phrase “View △△ by 〇〇,” “〇〇” refers to a dimension, and “△△” refers to a metric.
For example, if you want to know the “number of sessions per page,” then “Page (URL)WhateverTotal number of sessions"..." can be rephrased as "I want to know...".

In other words, let's enter the "Page Title"—which is the title of each page—into the "Dimension" field, and "Sessions"—which allows us to track the number of sessions—into the "Metric" field.
Then, place the selection from the "Dimension" in either "Rows" or "Columns," and the selection from the "Measure" in "Values."
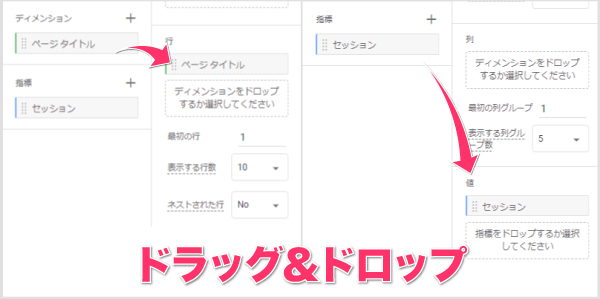
*Generally, if there is only one dimension, it is placed in the "Rows" section; if there are multiple dimensions, it is placed in the "Columns" section as well.
This allows you to display the number of purchases for each page (by title).
*To track the number of purchases, you must configure the “purchase” event, which is recommended.
By the way, when you hover your cursor over items such as “Page Title” or “Purchase” selected under Dimensions or Metrics, a description of that item appears, which helps you decide which item to use.
We’ve also listed some frequently used items below, so please be sure to check them out.
Common Combinations for Free Exploration
Some of you who have just started using Google Analytics may still be unsure which metrics to focus on.
So, to give you a taste of exploration, we’ll start by introducing some commonly used combinations of dimensions and metrics.
Dimension (Row) "Page Title" × Metric "Sessions"
When you want to view the number of sessions per page by page titleI'll use it for that.
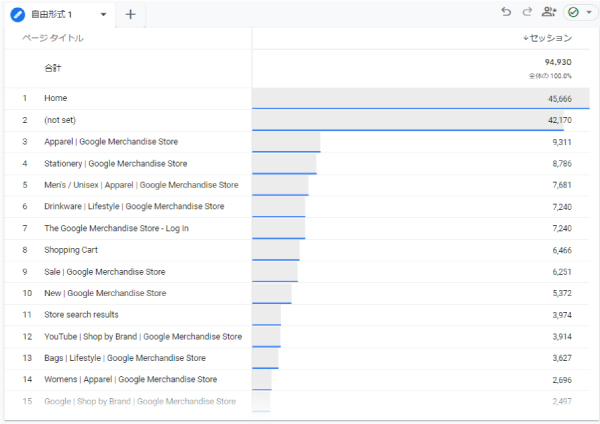
This is the combination I use most often because the title lets me intuitively see which pages have the most views.
By the way, aside from “Session,”
・Number of sessions with engagement
・Number of engagement sessions (per user)
・Number of views
Since some metrics—even those with similar names—have different definitions and produce different numerical values, you should choose which one to use based on what information you’re most interested in.
Dimension (Row) “Landing Page + Query String” × Metric 1 “Sessions” × Metric 2 “Purchases”
When you want to identify which page was the first one that contributed to the purchaseI'll use it for that.
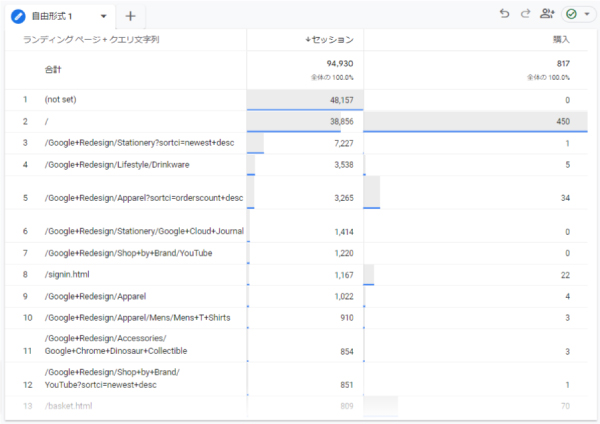
This combination allows you to see at a glance—especially when running ads—which media channels, banners, comparison sites, and article landing pages are driving the most traffic.
*You must include UTM parameters or ad codes in the URL as parameters so that each can be distinguished.
If you add the “segments” (which will be explained later) here, you can further narrow your view to specific ad codes and see at a glance, by date, which landing page generated the most purchases.
Dimension 1 (Rows) “Time” × Dimension 2 (Columns) “Device Category” × Metric 1 “Sessions”
When you want to check which devices have the most sessions by time periodI'll use it for that.
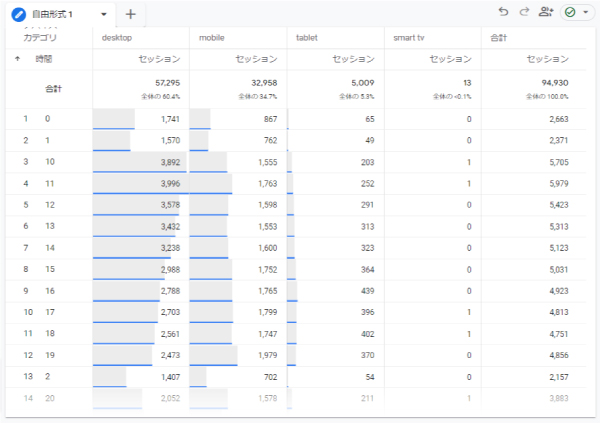
"Since there are a lot of desktop sessions between 10 a.m. and 12 p.m., it seems like many people are viewing the site while at work." This combination is useful because it makes it easier to visualize the usage patterns of your target users at that time.
Items Commonly Used in Dimensions
Here are a few other items commonly used in dimensions.
Page Path + Query String
When you want to track the numbers for each URL with parametersI'll use it for that.
If parameters are included in the URL, a value is displayed for each parameter; therefore, if you want to display the total value for the page excluding the parameters, use "Page Path and Screen Class."
Gender
Enabling Google Signals allows this data to be collected, and it will be displayed as “male,” “female,” or “unknown.”
However, since this data can only be collected when users are signed in to Google and have “Ad Personalization” turned on, we can only identify general trends.
Age
Just as with gender, enabling Google Signals allows you to collect this data; while you cannot obtain all user data, you can identify certain trends.
As with UA, the age categories are displayed in 10-year increments: “18–24,” “25–34,” “35–44,” “45–54,” “55–64,” “65+,” and “unknown.”
Region
When you want to know which regions the traffic is coming fromI'll use it for that.
In Japan, prefectures are displayed using the Romanized spelling, and when sorted in ascending order, they are listed alphabetically.
Items Commonly Used in Metrics
We’ll also introduce some commonly used metrics.
Number of views
When you want to track how many times a user has viewed a pageI'll use it for that.
Although the terms mean exactly what they say, they are often confused with each other, so let me clarify: “impressions” refer to the number of page views, while “sessions” refer to the number of visits.
For example, if a single user visits the site once and views three pages, the page views count is 1 and the sessions count is 3.
By the way, a single visit counting as three page views can occur if a user reloads the same page three times, so if you don’t want to count reloads, be sure to configure the settings accordingly.
<参考記事>
https://www.ga4.guide/reload-ignore/
Conversion
When you want to know the number of events set up as conversions in GA4I'll use it for that.
If you’ve set “purchase” as your only conversion, the number will remain the same. Use this feature when you’ve set multiple conversions—such as visits to specific domains or file downloads—and want to track the total number of conversions.
Number of New Users
When you want to identify users visiting your site or app for the first timeI'll use it for that.
It's useful because, when combined with page titles and other factors, it helps you identify which pages bring in the most new users.
Advanced: How to Use "Segments"
Finally, as an advanced topic, I’ll show you how to use segments.
Simply put, a segment is a "filter" function.
Use this when you want to filter by specific criteria, such as “visitors from Instagram ads” or “only ads served by Agency A.”
However, when using segments like these, it’s important to understand which events and event parameters can be applied as filtering criteria.
For example, if the information you want to know is “the number of sessions and purchases for landing pages containing a specific ad code in their URLs,” you need to set “Landing Page + Query String” as the dimension (row), “Sessions” as the first metric, and “Purchases” as the second metric, and then create a segment for “URLs containing the specific ad code AAA.”
In this case, the required condition is that “the page parameter ”page_location' contains AAA."
First, select “User Segments” by clicking the “+” button next to the segment.
*Or "Session Segment"
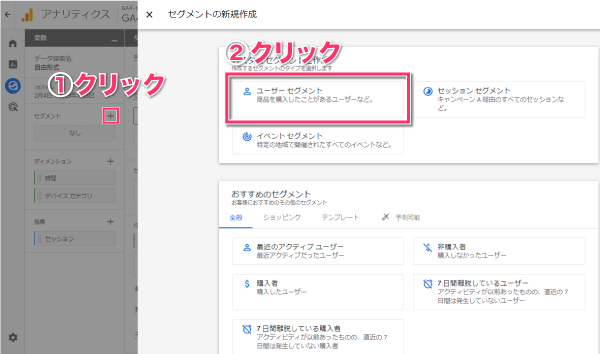
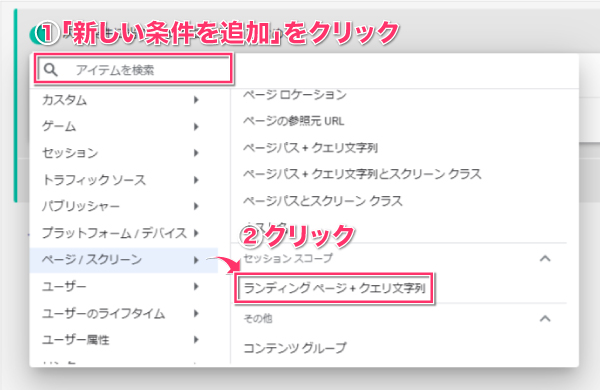
Next, select “Page / Screen > Page Location” from “Add New Condition,” and
*Or "Page / Screen > Page Path + Query String"
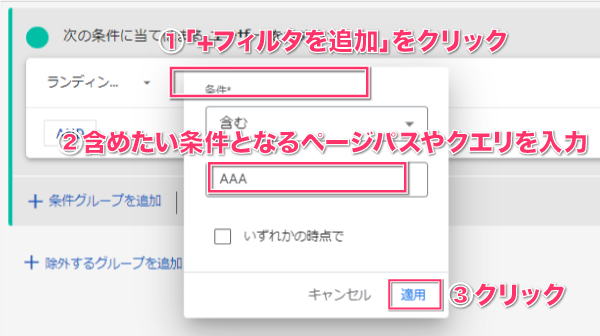
Set the "page path or query for the LP you want to filter" in the filter and apply it
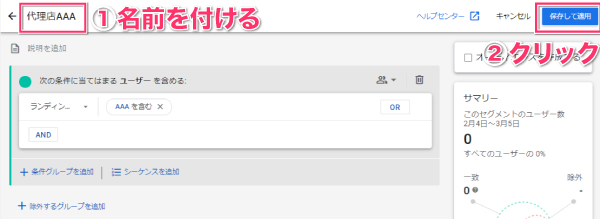
Just name the segment and click "Save and Apply," and you're done.
By the way, since a single user may have multiple sessions, the numbers for “Session Segments” tend to be higher than those for “User Segments.”
Summary
If you want to view more detailed reports in Google Analytics, you’ll need to use the “Explore” feature, but to do so, you’ll need to have a basic understanding of concepts such as “events,” “dimensions,” and “metrics.”
I realize this might be a little confusing for first-time users, but since you can analyze the information you're interested in for free, I highly recommend giving it a try.
In addition, while this article focused on how to view detailed reports within GA4, I expect that viewing data collected in GA4 via Looker Studio or exporting it to BigQuery using SQL will become the norm in the future, so I plan to write articles on those topics as well.
Thank you for reading to the end.